Easy Trading Tips offers free forex and commodities technical analysis, trading forecast, latest stock market, forex, commodities & business news, real time quotes, live charts, live markets data, economic calendar and many more.

Forex Trading Signals

Easy Trading Tips provides daily forex forex trading signals of top currency pairs and commodities. Our forex signal is based on recent market trends, support and resistance levels, and technical indicators. You can find the latest forex forecast below.

What is a Forex Trading Signal?

Forex trading signals refer to trading ideas or suggestions executed at a predetermined price and time on a specified currency pair. Forex trading signals can help you enhance trading activities.

Trading signals generated by the study of historical price movements in order to identify the patterns, support resistance and market trend to determine the probabilities of future movements. There are many ways to identify shapes and patterns in the market, here are some of the most commonly used techniques for finding the best trading signals.

Chart patterns: In the study of chart pattern, technicians use drawing tools (such as horizontal lines, trend line channels, and Fibonacci levels) to identify chart patterns, such as head and shoulders patterns, triangle patterns, flags patterns and many other patterns. These price patterns give the clarity of the strength and weakness of buyers and sellers in the market. The following are some of the most commonly used chart patterns.

1. Head and Shoulders

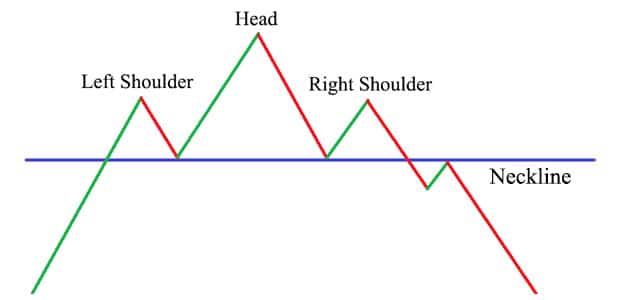
The head and shoulders chart pattern is the most powerful reversal price pattern that helps traders determine when a reversal may occur after a trend move. This reversal pattern indicates that the trend has ended which helps us to create a better forex forecast. The head and shoulders pattern forms with the combination of three picks includes a left shoulder, head and right shoulder with a baseline.

The two outer peaks are closed in height, called left shoulder and right shoulder, while the middle peak is closed in highest height, called head. The head and shoulders are a reversal chart pattern and are considered to be one of the most reliable trading trend reversal patterns.

forex trading signals

You can use the trend line to draw a neckline of the left shoulder, the bottom of the head and the right shoulder. When the price breaks through the neckline and continues to fall, this is the confirmation of the completion of the head and shoulders pattern. If the price falls below the confirmation neckline and closes below the neckline (support line), a bearish signal is confirmed.

Inverse Head and Shoulders

The head and shoulders reverse pattern is the reverse version of the head and shoulders pattern. The inverted head and shoulders pattern is upside down, indicating a change in the previous trend.

2. Double Top/ Double Bottom

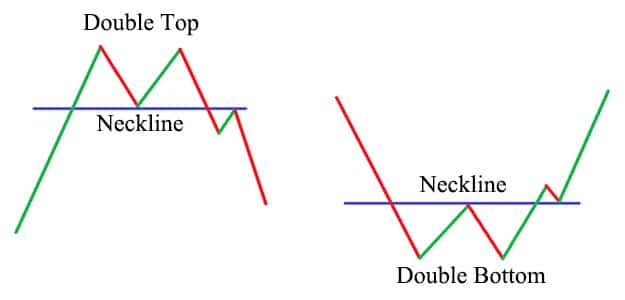
The Double top and double bottom are very common reversal price chart patterns. The double top is a bearish pattern that appears after a strong upward trend, and the double bottom is a bullish pattern that appears after a strong upward trend. The double top pattern provides selling opportunities, and the double bottom pattern provides buying opportunities.

In a double top, the top is the peak that cannot be broken when the price reaches a certain level. After reaching this level, the price will drop slightly, but then return again to test the higher price level, and try to break through the resistance level and then fall back to the downward trend.

trading signals

The double bottom is a bullish pattern, which forms in a falling market. It is similar to the double top, except that the price is inversely proportional. When the price rises above the neckline, a double bottom pattern is formed and confirmed, which gives buying opportunities.

3. Flags

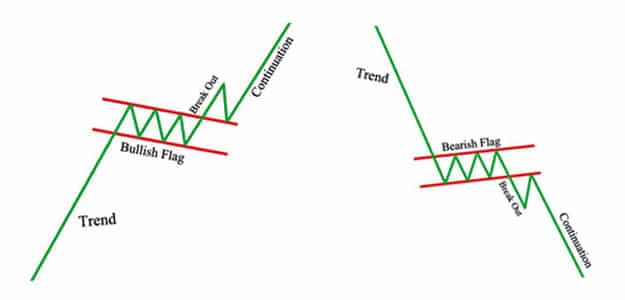
Flags patterns are form when prices consolidate after a sharp trending move. Flag patterns can be either upward trending which is called a bullish flag or downward trending which is called a bearish flag. These parallel lines can be flat or point in the opposite direction of the market trend.

forex forecast


The bullish flag pattern and the bearish flag pattern have a similar structure, but the bullish flag patterns are found in an uptrend, while the bearish flag pattern is in a downward trend. It is called a flag pattern because when you see these patterns on the chart, it looks like a flag.

Bullish Flag:

When the price rises in an upward trend and the price consolidates, a bullish flag is formed, creating a channel with support and resistance. When the price breaks and closes above the resistance line, a potential buy signal will be found. The bullish flag pattern has completed when the price breaks out of the upper trend line.

Bearish Flag:

The bearish flag is an upside down version of the bullish flag. Bearish flag patterns are found when the price moved downward, then after a period of price consolidation, a potential sell signal is given when price penetrates and closes below the support line. The bearish flag pattern has completed when the price breaks out of the lower trend line.

The bearish flag is an upside down version of the bullish flag. A bearish flag pattern was found when the price moved down, and then after a period of price consolidation, when the price penetrated and closed below the support line, a potential sell signal was formed. When the price breaks below the trend line, the bearish flag pattern has been completed.


4. Wedges

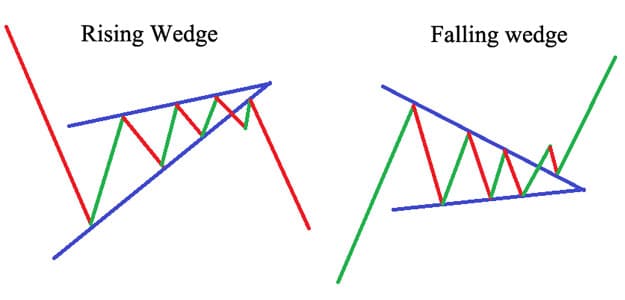
A wedge pattern is formed at the top or bottom of the trend. These patterns are drawn using two trend lines. The wedge pattern has rising or falling slopes pointing in the same direction. It differs from a triangle in that both boundary lines are inclined upward or downward. Falling and rising wedges are a small part of a trend. Volume usually decreases gradually during the formation of the wedge pattern, and only increases when the price breaks through or falls below the pattern.

Falling wedge:

The falling wedge pattern is a continuation pattern formed when the market creates lower lows and lower highs after a strong upward trend. A trend line drawn above the high and below the low on the price chart. This pattern is found in a minor downward trend. When the pattern is found in an upward trend, it is considered as a bullish pattern, as the market range becomes narrower into the correction, indicating that the downward trend is losing strength and is recovering the upward trend.

forex signals

Rising Wedge Pattern:

The rising wedge is just opposite to the falling wedge, and it is seen in a downward trend. Traders should understand the difference between rising and falling wedge patterns in order to effectively identify and trade them.


5. Triangles

The triangle pattern is the most popular chart pattern and is usually used in technical analysis tools. Triangle patterns are very important because they can help traders identify bullish or bearish markets. The triangle pattern is a continuous pattern, which assumes that the price will continue in the direction of the trend before the pattern appeared.

signals
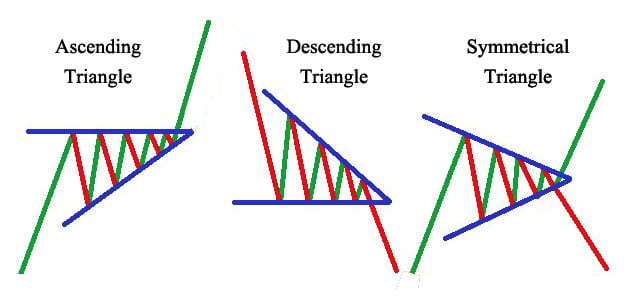
There are three types of triangle patterns, namely ascending, descending, and symmetrical.

Ascending triangle:  An ascending triangle is a bullish continuous pattern formed when the upper trend line is flat or horizontal and the lower trend line continues to rise diagonally.

Descending triangle: The descending triangle is a bearish continuation pattern. They are the inverted form of an ascending triangle.

Symmetrical triangle: A symmetrical triangle is a continuation of the previous trend, which may be a bullish or bearish.

6. Candlestick Patterns

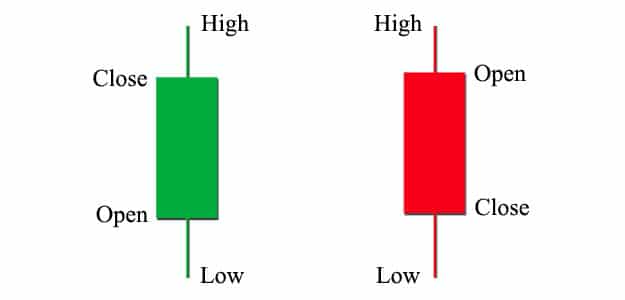
Candlestick patterns are very important in technical analysis. If you do not understand candlestick patterns, it is impossible to get success in trading. The candlestick pattern was first developed by Munehisa Homma in Japan in the 1700s. A candlestick is a price movement graphically displayed on a candlestick chart. Any candlestick will display the opening price, the highest price, the lowest price and the closing price of the security during a specific period.

forex trading


It consists of a body and shadow or wick. The wider part of the candlestick between the opening price and the closing price is called the real body. The real body provides us with important clues about market sentiment. Longer white/green candlesticks indicate strong buying pressure, while longer black/red candlesticks indicate huge selling pressure.

There are hundreds of candlestick patterns, but some candlestick patterns are very important to generate forex trading signals. Here you can find the top 10 most powerful candlestick patterns.