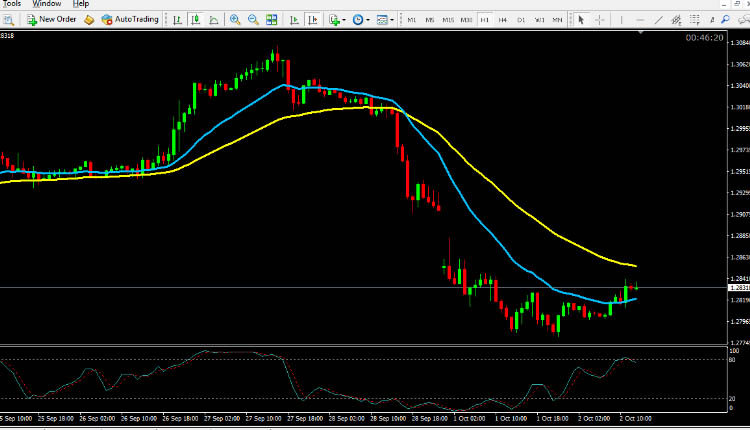
USD CAD Technical Analysis October 2, 2018
The USD declined 0.31% against the CAD on Monday and closed at 1.2812. Today in European session while USD CAD technical analysis October 2, 2018 is preparing at at 10:45 GMT, the USD/CAD trading at 1.2828, which is 0.12% higher against CAD from yesterday’s close.
In American session, data showed that the September data showed that overall growth in Canadian manufacturing slowed, mainly due to increased production and new jobs. Strong manufacturing opportunities were created in September as manufacturers sought to improve their operational capabilities and reduce backlogs. At the same time, the extended lead time of suppliers continues to influence the procurement strategy, and another significant increase in the investment in manufacturing by manufacturers has highlighted this. The seasonally adjusted IHS Markit Canadian Manufacturing Purchasing Managers Index fell from 56.8 in August to 54.8 in September, indicating the slowest improvement in overall business conditions since December 2017.

USD CAD technical analysis October 2, 2018
The pair is expected to find the support at 1.2768 and a fall through could take it to the next support level of 1.2723. The pair is expected to find its first resistance at 1.2870, and a rise through could take it to the next resistance level of 1.2928. For today the expected trading range is between 1.2700, Support and 1.3000 Resistance.
The expected trend for today is Bullish
Supports Levels: Support 1: 1.2768 Support 2: 1.2723 Support 3: 1.2665
Resistance Levels: Resistance 1: 1.2870 Resistance 2: 1.2928 Resistance 3: 1.2972
Previous day`s high: 1.2883
Previous day`s low: 1.2781
USD/CAD Buying Opportunity for Intraday Trading October 2, 2018
Buy near the support area 1.2768 and 1.2723 as soon as you get reversal candlesticks patterns like Hammer, Bullish Englufing, Long Leged Doji or Dragonfly Doji, using stop loss 2 pips above the reversal candlestick & keep target equal to stop loss.
USD/CAD Selling Opportunity for Intraday Trading October 2, 2018
Sell near the resistance area 1.2870 and 1.2928 as soon as you get reversal candlesticks patterns like Shooting Star, Bearish Englufing, Long Leged Doji or Gravestone Doji, using stop loss 2 pips above the reversal candlestick & keep target equal to stop loss.
EUR/USD Technical Analysis October 2, 2018
GBP/USD Technical Analysis October 2, 2018
USD/JPY Technical Analysis October 2, 2018


sir ap subscribe wala system lo jise hame instant pata chal jaye apke update
Ok Prasant ji I will try, thank you so much for your interest